
Predictive Maintenance Failure Classification & Anomaly Detection
Two-layer detection system for industrial sensor data combining XGBoost failure classification and Isolation Forest anomaly detection into a real-time monitoring dashboard.
- Role
- Machine Learning Engineer
- Timeline
- 2026
Industrial downtime & problem statement
Unplanned downtime in manufacturing and industrial facilities leads to severe production losses, safety hazards, and expensive emergency repairs. Traditional maintenance relies on rigid schedules or reactive interventions after physical damage has already occurred. This project builds a real-time predictive maintenance system that continuously analyzes sensor telemetry to identify subtle degradation signatures and provide early warnings before equipment breakdown.
Using the AI4I 2020 predictive maintenance benchmark dataset (10,000 synthetic records reflecting real-world milling machine operations with a ~3.4% failure rate), the system processes five critical physical parameters: air temperature, process temperature, rotational speed, torque, and tool wear.
Dataset & operational scope
- 10,000
- Sensor telemetry readings
- 5
- Physical sensor dimensions
- 3.4%
- Imbalanced failure incidence
Stratified industrial records across diverse machine operation cycles.
Air temperature, process temperature, rotational speed, torque, and tool wear.
339 total failure events reflecting realistic high-reliability manufacturing environments.
Two-layer detection architecture
Industrial failures fall into two distinct categories: known failure modes with historical precedent, and unprecedented operational anomalies caused by novel mechanical or environmental stressors. A single supervised model struggles to catch unseen anomaly patterns, while a purely unsupervised detector produces high false alarm rates. To resolve this trade-off, the architecture implements a synchronized two-layer detection strategy.
Layer 1: Supervised XGBoost Classifier. Trained on multi-class labeled failure data with gradient boosting and scale_pos_weight parameterization to counter the severe 3.4% class imbalance. It predicts imminent breakdown probability and categorizes specific failure modes—including Tool Wear Failure (TWF), Heat Dissipation Failure (HDF), Power Failure (PWF), and Overstrain Failure (OSF).
Layer 2: Unsupervised Isolation Forest. Trained exclusively on 100% normal operating baseline data. By isolating observations across multidimensional feature space through random partitioning trees, it calculates anomaly severity scores and flags abnormal trajectories even if they do not match any historical failure signature.
Decision triangulation & risk scoring
The system unifies predictions from both models into a three-tier operational risk matrix: (1) Normal Status when both models verify nominal operating parameters; (2) Anomaly Warning when the classifier considers the operation normal but the Isolation Forest score exceeds the outlier threshold, flagging a potential novel failure mode for inspection; and (3) Critical Failure Alert when XGBoost predicts a high-confidence imminent failure.
This multi-layered triangulation ensures broad operational coverage: plant operators receive prioritized actionable alerts with identified root causes, while maintenance engineering teams can investigate zero-day anomalies before they cascade into catastrophic mechanical failure.
Model performance on test evaluation
- 98%
- Overall model accuracy
- 78%
- Failure recall rate
- 0.75
- Failure F1-score
- 72%
- Failure precision rate
Evaluated on a 2,000-sample stratified holdout test split.
Prioritized recall over precision to minimize costly missed equipment breakdowns.
Harmonic balance between false alarms and critical detections on imbalanced data.
53 true failures correctly identified against only 21 false alarms.
Test evaluation & streaming dashboard
Rigorous evaluation on the 2,000-sample test set confirmed strong diagnostic reliability: 1,911 true normal states were correctly verified, 53 actual failures were successfully flagged out of 68 total breakdown events, with only 15 missed failures (false negatives) compared to 21 false alarms (false positives).
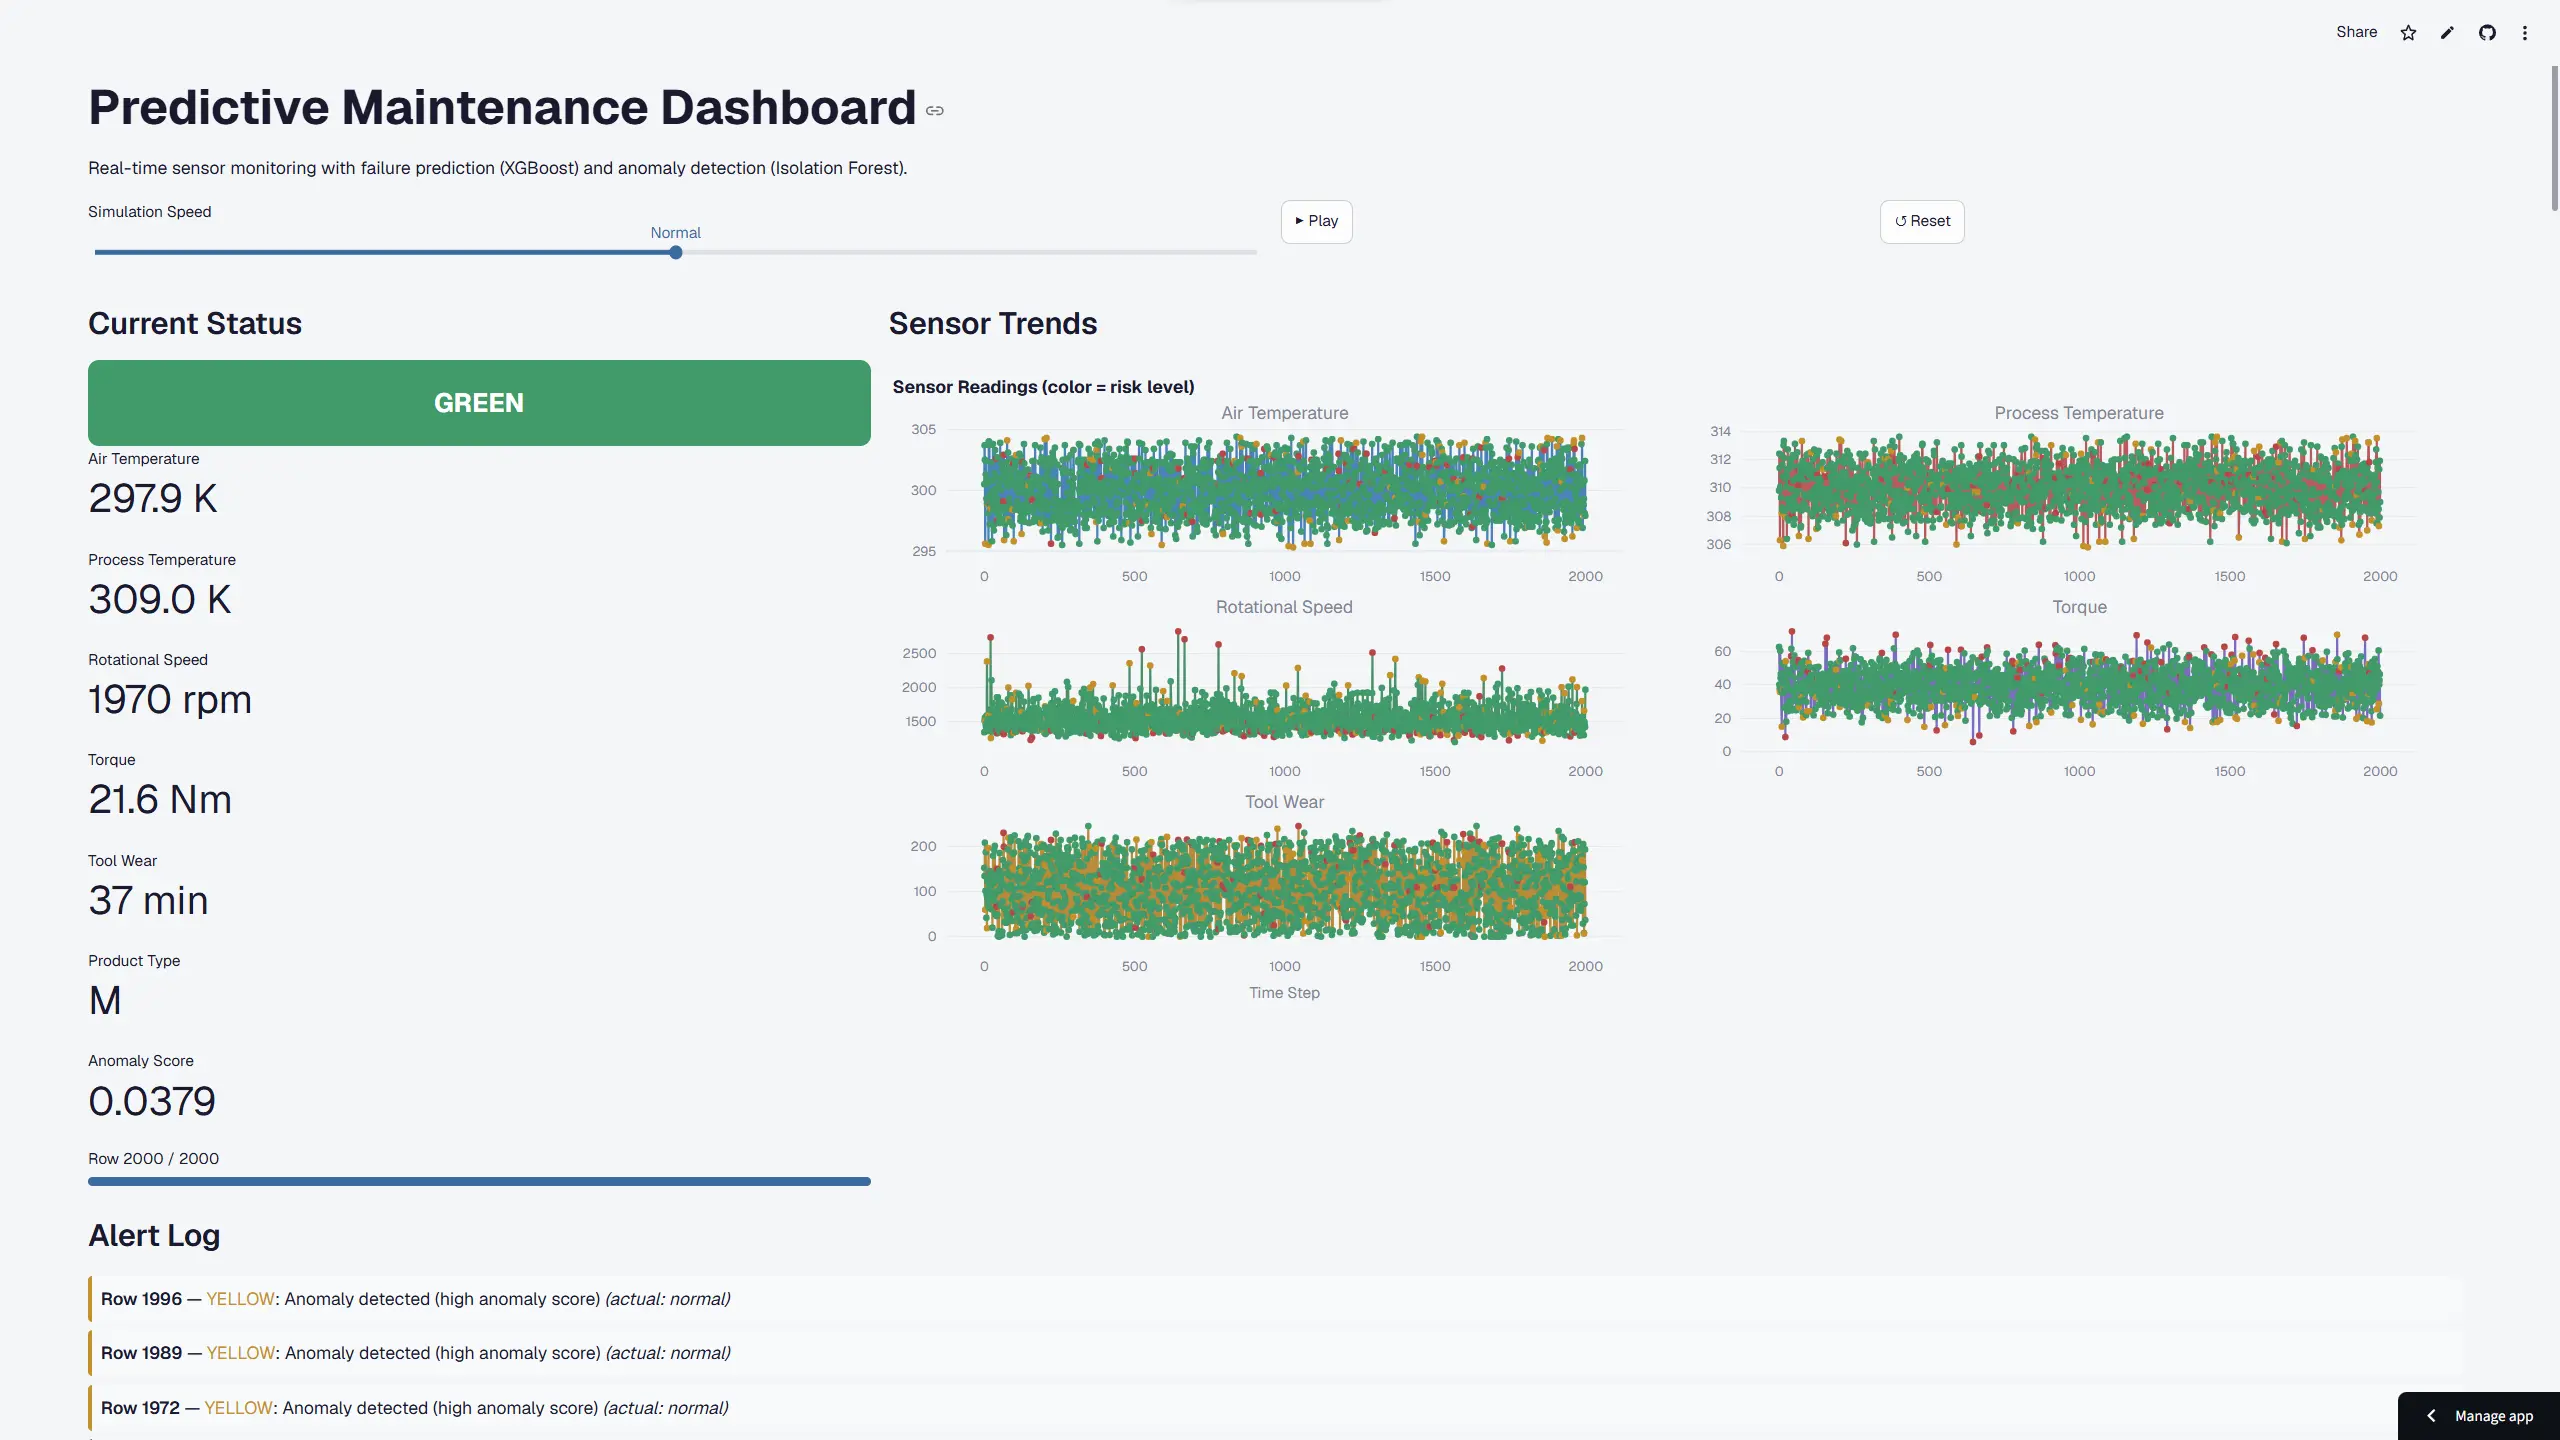
The end-to-end system is deployed as an interactive Streamlit web dashboard. Operators and engineers can stream real-time synthetic sensor telemetry, adjust operational parameters via interactive sliders, monitor live dual-model risk gauges, inspect Plotly time-series degradation trends, and view automated alert logs for immediate maintenance dispatch.
Keep exploring the work.